Gold Prices, Demand & Structural Risk

An evidence-based assessment · March 2026
Two distinct concerns are being raised right now — they have different evidence and different answers. Don't conflate the two.
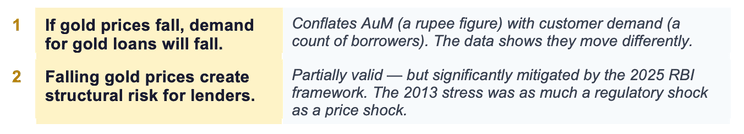
1. Demand: what the numbers show
A farmer who needs ₹40,000 for crop inputs needs ₹40,000 regardless of whether gold trades at ₹80,000 or ₹50,000 per 10g. What changes with price is not the need — it is how much gold the borrower must pledge to get it. At ₹80,000 per 10g and 75% LTV, 7 grams gets them ₹42,000. At ₹50,000, they need 11 grams for the same amount. Same borrower. More gold pledged. The demand for credit does not move with gold prices. The collateral math does.
AuM growth has been primarily price-driven
AuM is not a single number. It is three things multiplied together:
AuM = (No. of accounts) × (Grams pledged per account) × (Gold price × LTV%)
Gold Price Growth (CY2015 – CY2025)
- Gold moved from ₹26,671/10g (CY2015 average, RBI data) to an average of ₹1,23,000/10g in CY2025.
- Over this 10-year timeframe, the price of gold increased by approximately 4.6x.
Organised Gold Loan Market AuM (FY2015 – FY2025)
- The market grew from ₹1.77 lakh crore (FY2015, KPMG) to ₹11.8 lakh crore in FY2025 (as of March 2025, confirmed by ICRA).
- The total AuM experienced a massive 6.7x increase over the decade.
Collateral Tonnage vs. Ticket Size
- Despite the explosive AuM growth, the actual gold tonnage pledged grew at a mere 1.7% CAGR from FY2020 to FY2025. Meanwhile, the average ticket size more than doubled, entirely subsidised by the underlying asset's price rally.
Understanding the Gap
- The Gap: We must reconcile the 6.7x AuM growth with the 4.6x gold price growth. The unexplained gap is 1.45x (6.7 ÷ 4.6).
- Account Growth: Moving from approximately 60 million accounts in FY2016 (KPMG) to roughly 90 million accounts by late 2025 (CRIF) yields a growth factor of 1.5x.
- The Conclusion: If the account growth (1.5x) completely covers the required AuM gap (1.45x), it means the remaining variable —the grams-per-account × LTV factor—has actually contracted slightly to ~0.96x.
Sector Insight: The math says that 100% of the industry's portfolio growth over the last decade was driven by a combination of new customer acquisition and asset price inflation. The collateral intensity per borrower has not increased; in fact, the average borrower is perhaps pledging slightly less gold per account today than they were ten years ago.
The AuM growth story is overwhelmingly price-driven. Anyone reading AuM as a demand signal is reading the wrong metric.
The historical stress test: 2012–2016
Between CY2012 and CY2015, gold prices in India fell **10.9% in annual average INR terms **— from ₹29,926/10g to ₹26,671/10g (Arthgyaan/RBI verified data). In USD, the same decline was ~24%, but rupee depreciation of ~15% over that period cushioned the fall significantly. This was a sustained three-year price decline — the worst the modern organised sector has faced.
Here is what organised sector AuM did across that period (KPMG, Dec 2017 — full FY09–FY16 series):
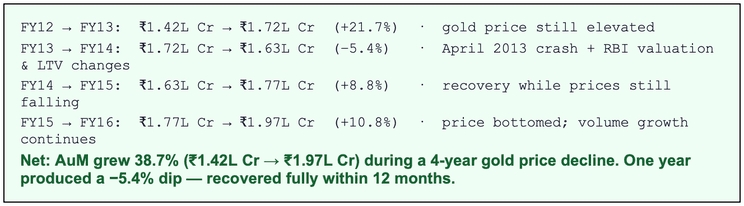
Over four consecutive years of mostly-declining gold prices, the organised sector grew its loan book by 38.7%. Customers did not leave when gold prices fell. When prices drop, borrowers simply pledge more gold to access the same loan amount. The rupee AuM dips temporarily; the customer base does not.
What actually happened in FY14 is worth understanding precisely — because it is often described loosely, and the devil is in the details:
- April 2013 — the precipitating shock. Gold fell approximately 20% in a single month globally. In India, this triggered margin calls, forced auctions at scale, and immediate LTV breach across a significant portion of NBFC & Bank portfolios. This was the actual stress event. The regulatory actions that followed were responses to it.
- September 2013 — NBFC LTV harmonisation (not a tightening). Gold-loan NBFCs had been capped at 60% LTV since March 2012 — far below banks. The RBI raised this to 75% in September 2013 to align both sectors. However, it simultaneously mandated valuation standardisation: gold must be valued at the 30-day average closing price, excluding making charges. Lenders could no longer use spot prices or inflate collateral values. The effective constraint was in the valuation methodology, not the LTV ratio itself.
- January 2014 — bank LTV formalised at 75% for the first time. Banks had no uniform LTV ceiling before RBI circular RBI/2013-14/459. Many were competing with NBFCs at 80–85% LTV. This circular introduced the first formal cap for banks, requiring restructuring of above-threshold loans.
The −5.4% AuM decline in FY14 is a total sector figure (banks + NBFCs combined). Within that: major gold-loan NBFCs saw AuM fall 15–18% over the full year. Banks, still expanding their gold loan portfolios through H1 FY14, partially offset the NBFC contraction at the aggregate level. Even looking only at the NBFC segment — 15–18% decline during a ~20% gold price shock, with simultaneous forced valuation changes — recovery to new AuM peaks within 18 months is not a picture of structural fragility. PwC's 2024 market report confirms the mechanism: 'Decline in gold prices led to unfavourable LTV; in some cases, the value of gold loan exceeded the collateralised gold, contributing to increasing NPA in the industry.'
That LTV breach scenario is now specifically addressed by the 2025 RBI continuous monitoring mandate — the safeguard did not exist in 2013.
Account volumes: the demand metric that matters
Demand for credit access does not pause when gold stops appreciating:
- 60 million active organised-sector loan accounts in FY2016 (KPMG) — across PSU banks, NBFCs, and co-operatives. Gold price: ~₹30,000.
- CY2019: Accounts grew to an estimated 75–80 million (supporting an AUM of ₹3.5 lakh crore). During this three-year period, gold prices remained mostly subdued and range-bound (reaching ~₹35,154, a modest 16.7% increase).
- FY2025: 90.26 million active accounts as of November 2025 (CRIF High Mark), continuing to grow at 10.3% year-on-year.
The structural driver is not gold prices. Gold loans are the only product that disburses in under 15 minutes with no credit history requirement. That gap does not change whether gold is at ₹50,000 or ₹80,000 per 10g.
There is one borrower segment where price sensitivity is real:
- Urban, higher-ticket carry-trade borrowers. Some borrowers take gold loans not from necessity but as leverage — borrowing against gold to invest in equities, real estate, or business assets during a bull cycle. When gold prices fall, this motivation disappears and these borrowers exit. The speculative sub-segment within that is smaller still, but concentrated in higher-ticket loans where NBFC margins are lowest.
- Fast, sharp price drops create operational, not demand, risk. This is not hypothetical — April 2013 is the historical precedent: gold fell ~20% in a single month, triggering simultaneous margin calls and forced auctions across every gold loan lender in India. It happened again, briefly, in March 2020. When this occurs, a lender's entire portfolio triggers LTV re-evaluation at once. Top-up requests go out at scale. Auctions must be processed simultaneously. For an under-resourced new entrant without systems, trained valuers, and auction-house relationships, this is a process risk, not a credit risk — but it is a real one. What the April 2013 episode also shows: the sector survived it. The 2025 RBI directions address the structural LTV monitoring side; operational readiness is a separate and genuine capability requirement for any new entrant.
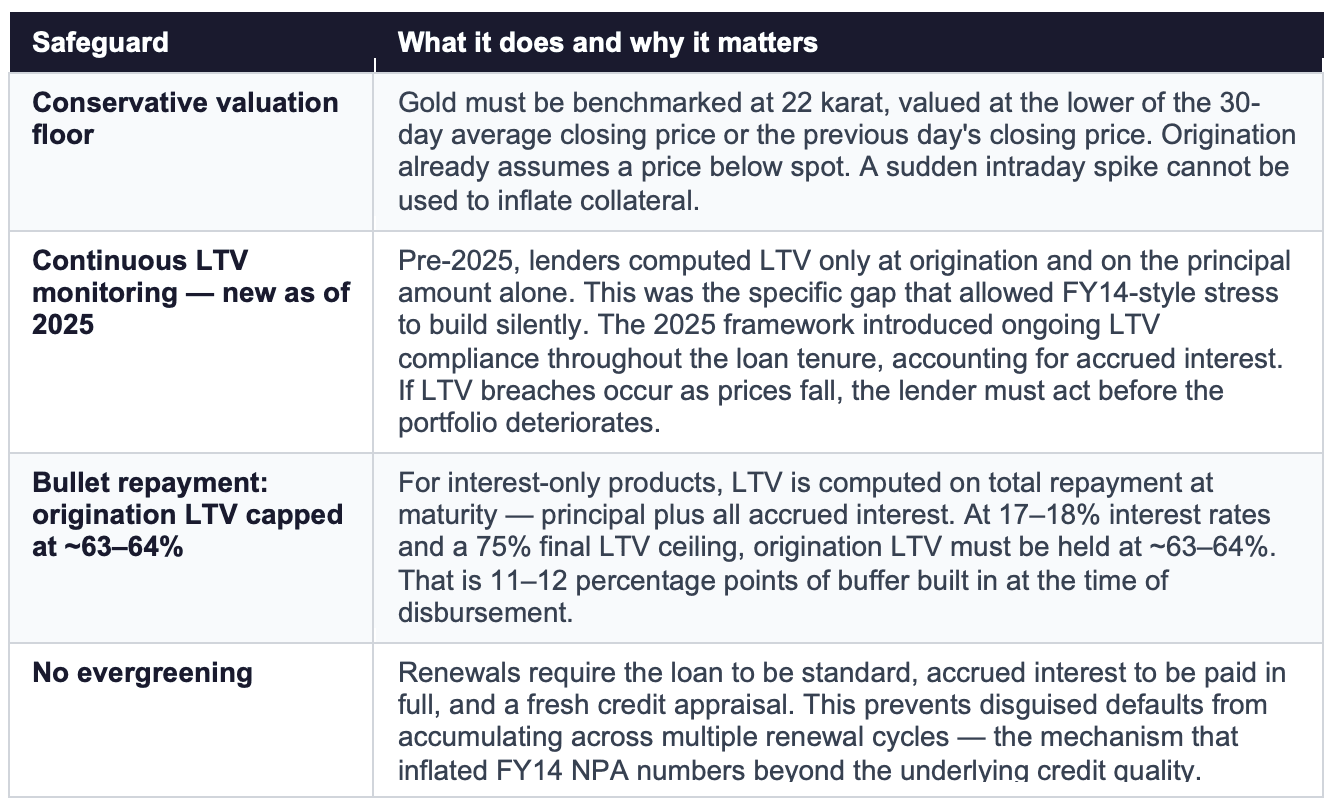
2. Structural risk: what the regulatory framework does
The 2025 RBI Directions on Lending Against Gold Collateral address the specific failure modes that caused the 2013–14 stress. Four mandatory safeguards are now in place:
3. Bottom line
In a severe gold price drop — say 25–30% — three things will happen. AuM will shrink in rupee terms. Auction volumes will rise. Some NPAs will emerge. None of these are surprises and none of them are existential for a well-capitalised, operationally prepared lender.
The FY2012–2016 precedent — AuM grew 38.7% over four years of declining INR gold prices, with only one year producing a −5.4% dip and a full recovery within 12 months — remains the most instructive evidence available. The counter-cyclical behaviour is consistent across the cycle: when gold prices fall, borrowers pledge more gold to access the same credit. The demand for credit is not a function of gold price.
On NPA resilience: bank GNPA on gold loans was 0.20% in FY23 and 0.22% in both FY24 and FY25 despite sharp portfolio growth. NBFC GNPA rose from 1.21% in FY23 to 2.58% in FY24 before improving to 2.14% in FY25. Critically, the FY24 NBFC spike was not driven by gold price movements — prices were rising strongly through FY24. It was driven by RBI compliance enforcement exposing LTV monitoring failures, cash disbursal irregularities, and ever-greened loan books. The FY25 improvement reflects operational remediation, not price recovery. This distinction matters: the FY24 stress event was a process failure, and the 2025 regulatory framework is specifically designed to eliminate that failure mode going forward.
#indiagold #GoldLoan #Fintech #PersonalFinance #DigitalLending #GoldLoanAtHome #SmartFinancing #FinancialInclusion #InstantCredit #HassleFree #WorkingCapital #SMEFinance #BusinessGrowth